Lender Dashboard
The Lender Dashboard gives a clear and organized overview of a selected broker’s proposal activities and overall performance. The dashboard includes visual tools such as pie charts and bar charts, offering insights into various aspects of proposal management. Additionally, all proposals are displayed in a searchable table format, allowing users to locate and manage specific proposals with ease.
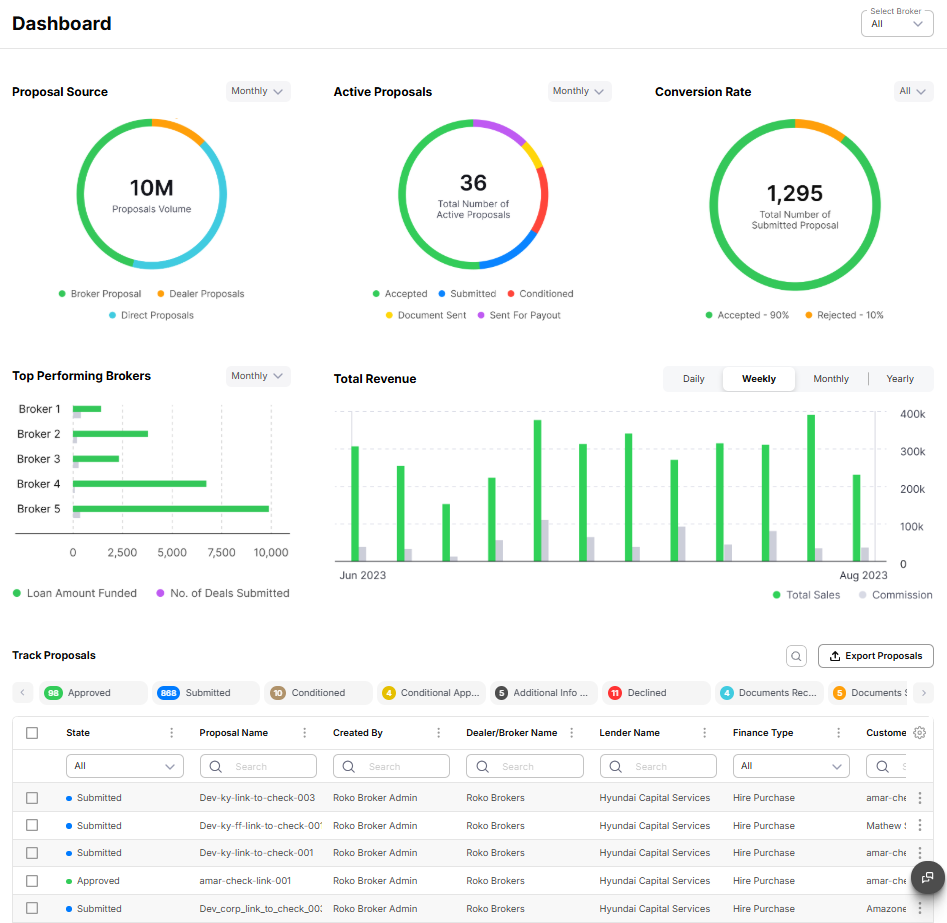
To select the broker(s), click the Select Broker dropdown on the top-right side of the dashboard and select the required broker(s). Once the broker(s) is selected, the dashboard will update all metrics automatically.
Proposal Source
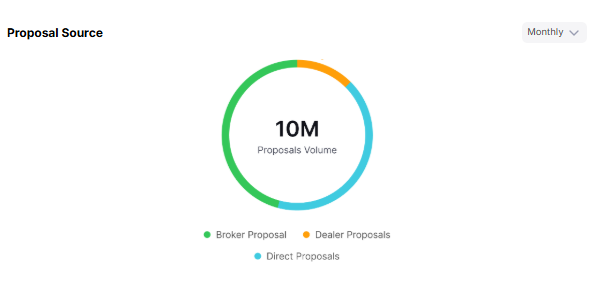
The Proposal Source pie chart provides a visual breakdown of proposals based on their origin. It categorizes proposal volume by sources such as Broker Proposals, Dealer Proposals, and Direct Proposals, allowing users to quickly identify which channels generate the highest number of proposals. Users can adjust the displayed data by selecting different time periods, including Weekly, Monthly, Quarterly, or Calendar Year, making it easier to compare proposal sources over time and identify trends.
Active Proposals
The Active Proposals pie chart visually represents the distribution of statuses for all active proposals. It categorizes proposals into statuses such as Submitted, Approved, Conditioned, Conditional Approval, Additional Info Required, Documents Received, Sent for Payout, Documents Sent, Awaiting Compliance, and Complied. Users can customize the displayed data’s time span by selecting options such as Weekly, Monthly, Quarterly, or Calendar Year. This helps users focus on specific periods and analyze trends effectively.
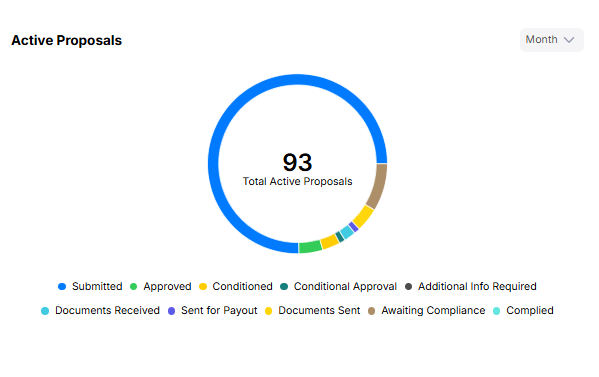
You can adjust the timeframe to Weeks, Months, Quarter, and Calender Year.
Conversion Rate
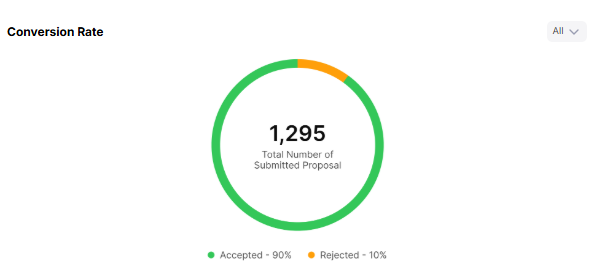
The Conversion Rate pie chart displays the overall outcome of submitted proposals by comparing Accepted and Rejected proposals. The chart also displays the total number of submitted proposals in the selected period, providing users with a quick overview of proposal success rates. Users can filter the displayed data by selecting the required time period, helping them evaluate performance across different reporting intervals.
Top Performing Brokers
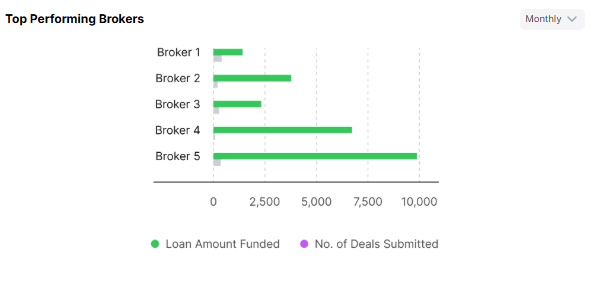
The Top Performing Brokers horizontal bar chart compares broker performance based on Loan Amount Funded and the Number of Deals Submitted. This enables users to identify brokers contributing the highest business volume and compare their overall performance. The chart can be filtered using the available timeframe options, allowing users to review broker performance over different periods.
Total Revenue
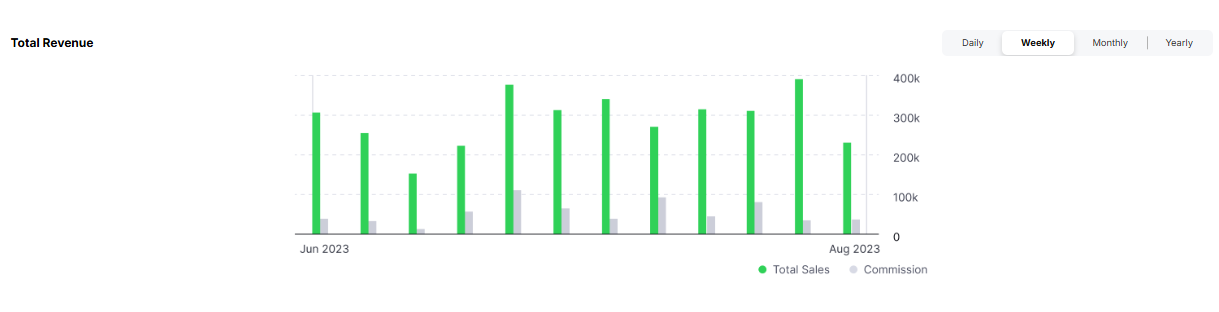
The Total Revenue bar chart provides an overview of revenue performance by displaying Total Sales alongside the associated Commission earned for each reporting period. This visualization helps users monitor revenue trends, compare sales against commissions, and evaluate overall financial performance over time. Users can switch between Daily, Weekly, Monthly, and Yearly views to analyze revenue at different levels of detail.
Track Proposals
The Lender Dashboard includes a comprehensive Track Proposals table that provides detailed information about each proposal. This table helps users manage proposals efficiently by filtering and sorting data according to specific criteria. A search bar is available at the top of each column for easy filtering. Users also have the option to Export Proposals using the dedicated button provided on the table, allowing for external analysis and reporting.
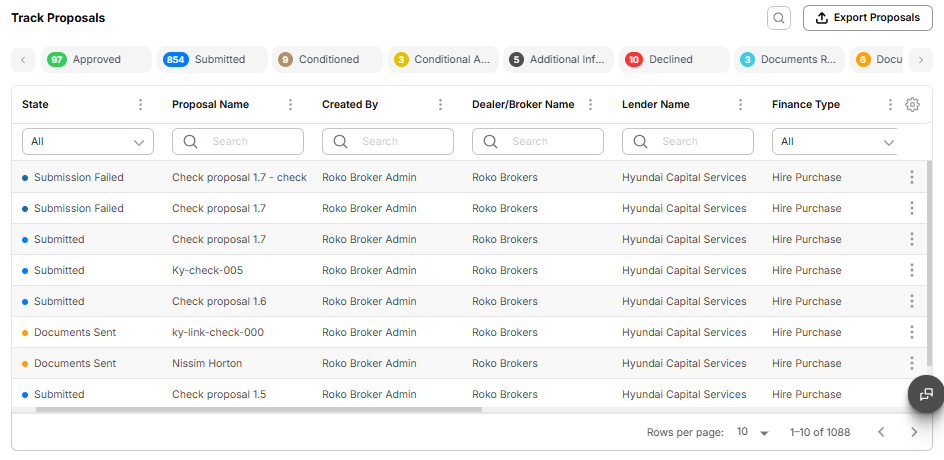
You can click the status cards to instantly filter proposals the specified status.
Columns Available
Track Proposals Columns Available
The available columns are configurable, the columns can be shown/hidden clicking the Gear on the right hand side of the table. Click the Gear Icon → Edit Columns to customize.
-
State: Displays the current status of the proposal. Users can filter proposals based on various states, such as All, Approved, Submitted, Conditioned, Declined, Documents Received, Documents Sent, Paid Out and Sent for Payout.
-
Proposal: Shows the unique identifier or name of the proposal. This column allows users to quickly identify specific proposals by their reference.
-
Created By: Displays the user who originally created the proposal.
-
Finance Type: Indicates the type of proposal, which helps in categorizing proposals based on predefined types or categories.
-
Customer Name: Lists the names of the customers associated with each proposal, allowing for easy identification of proposals by customer.
-
Dealership: Indicates the dealership linked to the proposal, which is especially relevant for dealer-submitted proposals.
-
Date Submitted: Indicates the date when the proposal was submitted, allowing users to sort and filter proposals based on submission dates.
-
Finance Amount: Displays the financial value or amount associated with the proposal, providing an overview of the monetary details of each proposal.
-
Last Updated: Shows the most recent date when the proposal was updated, helping users track the latest changes or updates made to each proposal.
-
Start Date: Displays the date when the proposal activities began, helping users monitor the initiation timeline.
-
End Date: Shows the date when the proposal activities are expected to conclude, aiding in deadline management.
The available and hidden/shown columns may differ from mentioned above depending on the configuration.
Actions Available on Ellipsis Menu
Track Proposals Actions Available
-
Manually Change Status: Enables users to manually change the status of a proposal, providing flexibility in managing proposal progress.
-
Withdraw Proposal: Provides the option to withdraw a proposal, effectively removing it from the active pipeline.
-
View Proposal Summary: Provides a summarized view of the proposal, highlighting key details and information in a concise format.
-
View Proposal: Allows users to view detailed information about a proposal.
-
Download Proposal: Enables users to download the proposal document, allowing for offline review and sharing.
-
Upload Documents: Allows users to upload necessary documents related to the proposal, facilitating document management and compliance.
-
Diary: Enables users to view a log of all changes made to the proposal, offering a detailed history of actions and updates for tracking purposes.
-
Clone Proposal: Enable the user to clone a proposal to be used as needed.
-
Send for Payout: Allows user to send the proposal for payout.
-
Resubmit Proposal: Enable the user to resubmit a proposal after making changes if required or for any allowed reason.
The available actions may differ depending on the configuration.