Performance Analytics
The Performance Analytics screen provides a comprehensive view of an individual analyst’s performance and productivity. It presents key performance indicators (KPIs), workload statistics, quality metrics, efficiency measurements, and performance trends to help users monitor their progress against defined targets. The screen also enables analyst’s to identify improvement opportunities and evaluate their overall contribution to the credit decisioning process.
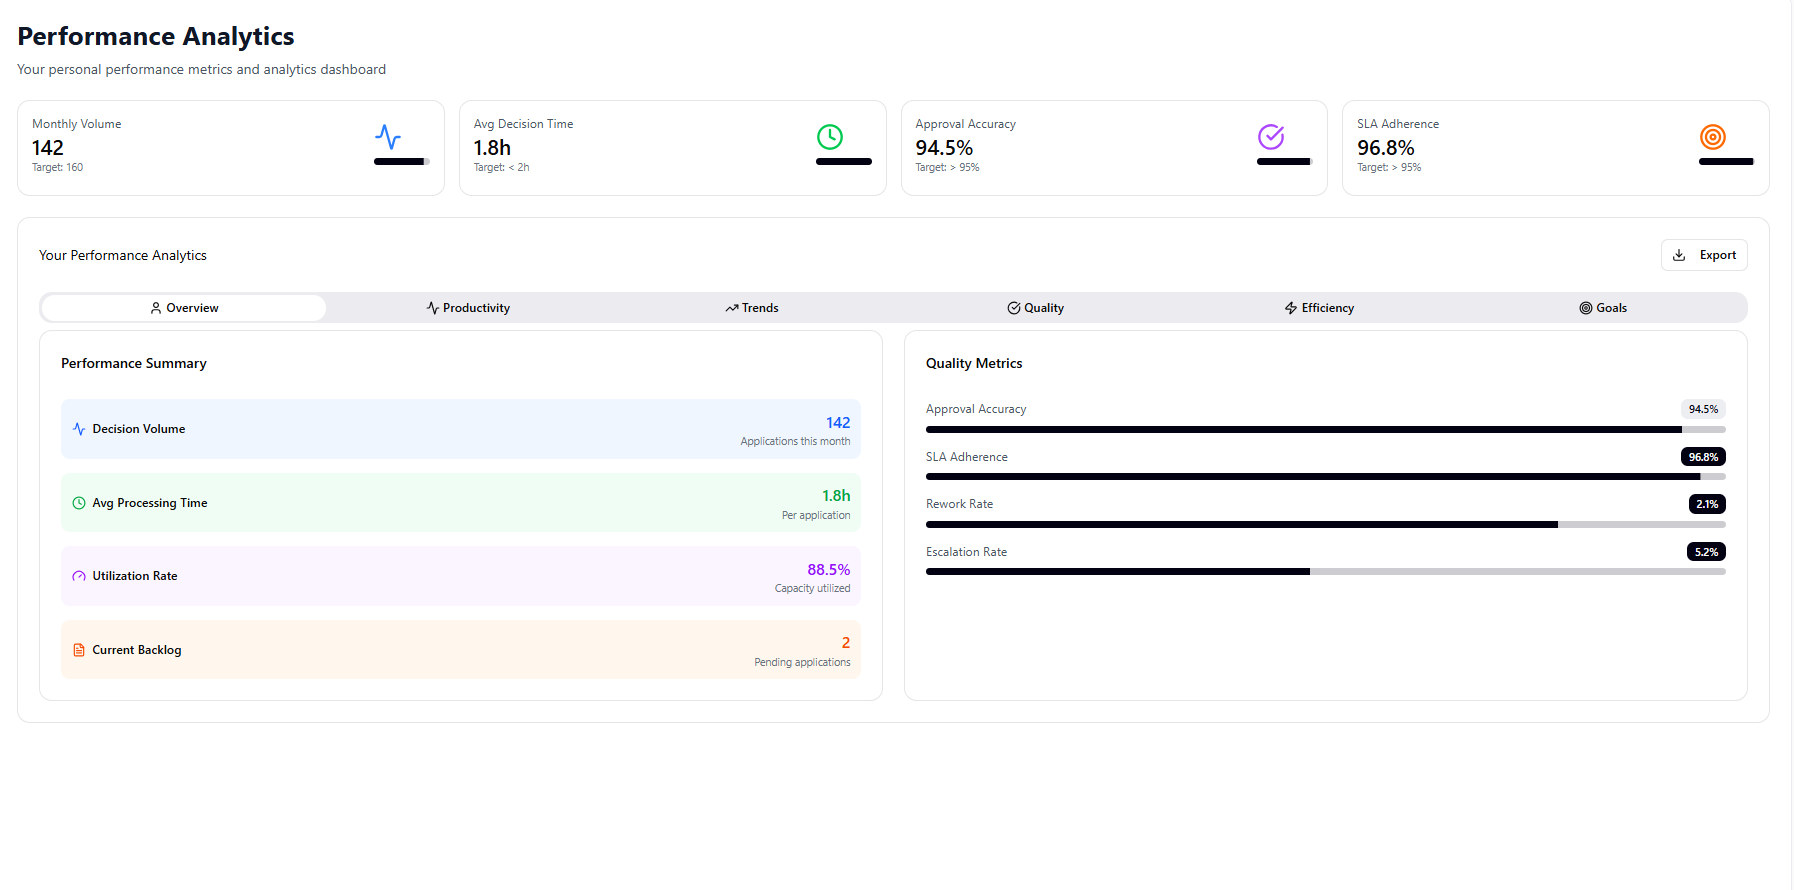
The following key performance indicators are displayed at the top of the screen:
- Monthly Volume – Displays the total number of applications processed during the current month together with the assigned target.
- Average Decision Time – Displays the average time taken to complete application reviews and compares it against the target processing time.
- Approval Accuracy – Displays the percentage of accurate credit decisions compared with the defined performance target.
- SLA Adherence – Displays the percentage of applications processed within the defined Service Level Agreement (SLA).
Your Personal Performance Analytics
The Your Personal Performance Analytics section provides detailed insights into individual performance across productivity, quality, efficiency, and goal achievement.
Overview
The Overview section summarizes the analyst’s current workload and overall performance.
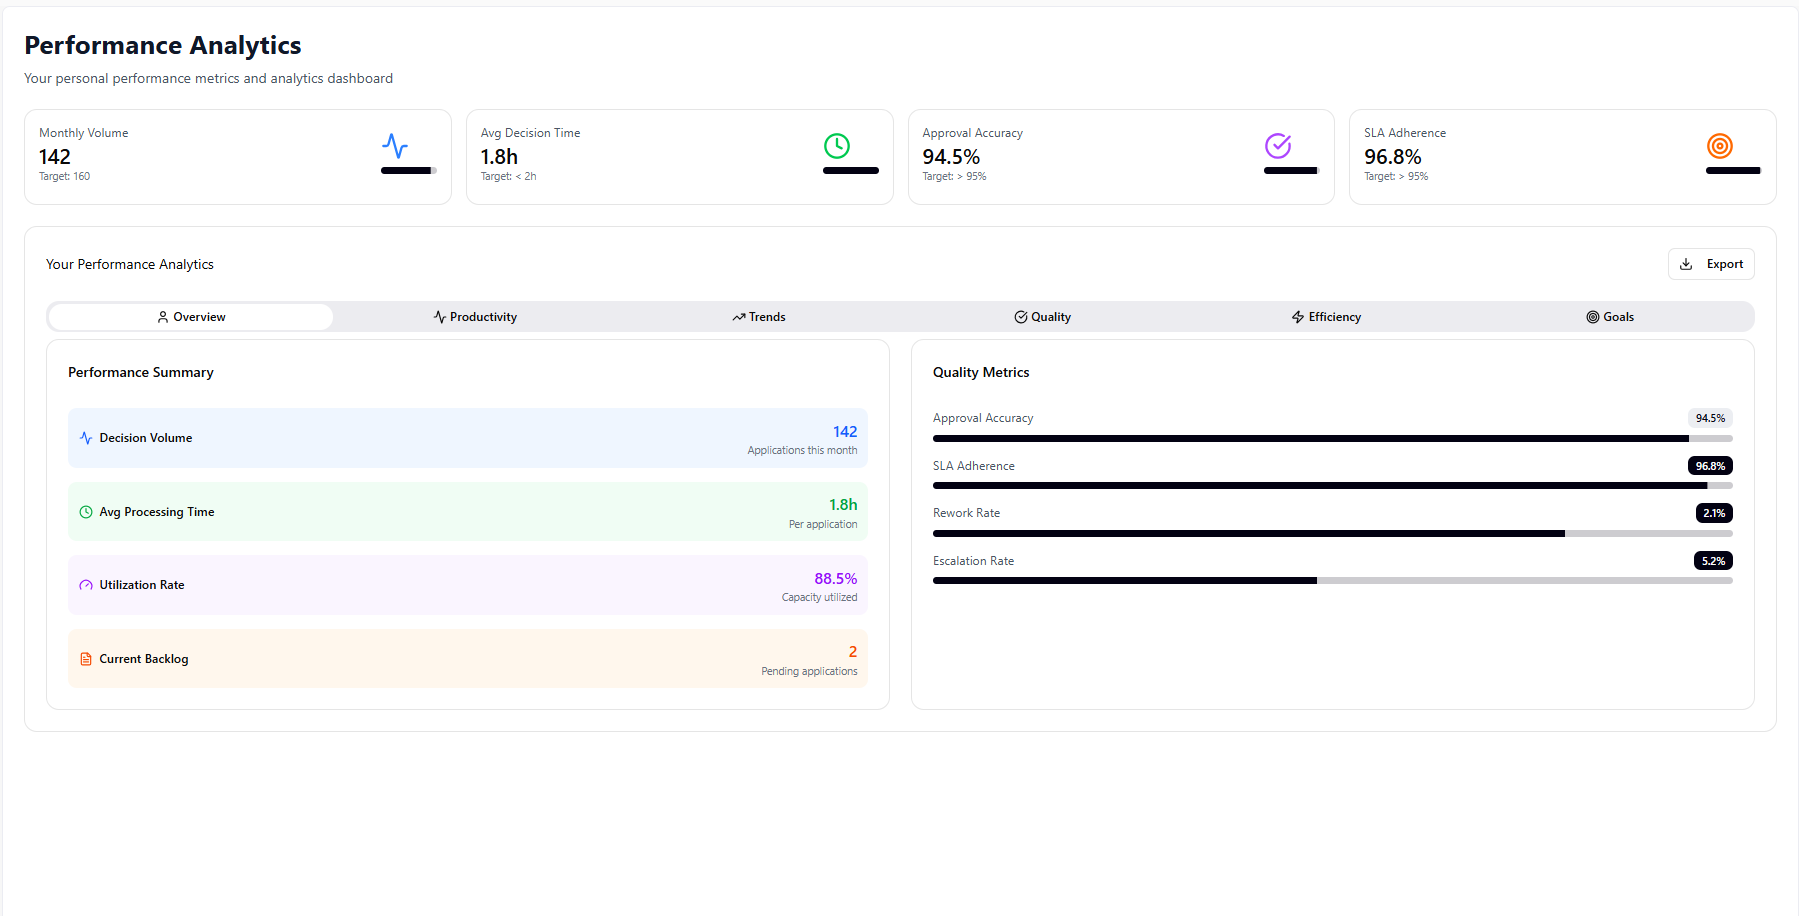
Performance Summary
Displays key operational metrics, including:
- Decision Volume – Total number of applications processed during the selected reporting period.
- Average Processing Time – Average time taken to process each application.
- Utilization Rate – Percentage of available working capacity utilized.
- Current Backlog – Number of applications currently awaiting processing.
Quality Metrics
Displays quality-related performance indicators, including:
- Approval Accuracy
- SLA Adherence
- Rework Rate
- Escalation Rate
These metrics help analyst’s evaluate the quality and consistency of their decision-making activities.
Productivity
The Productivity section provides graphical insights into application processing patterns over time.
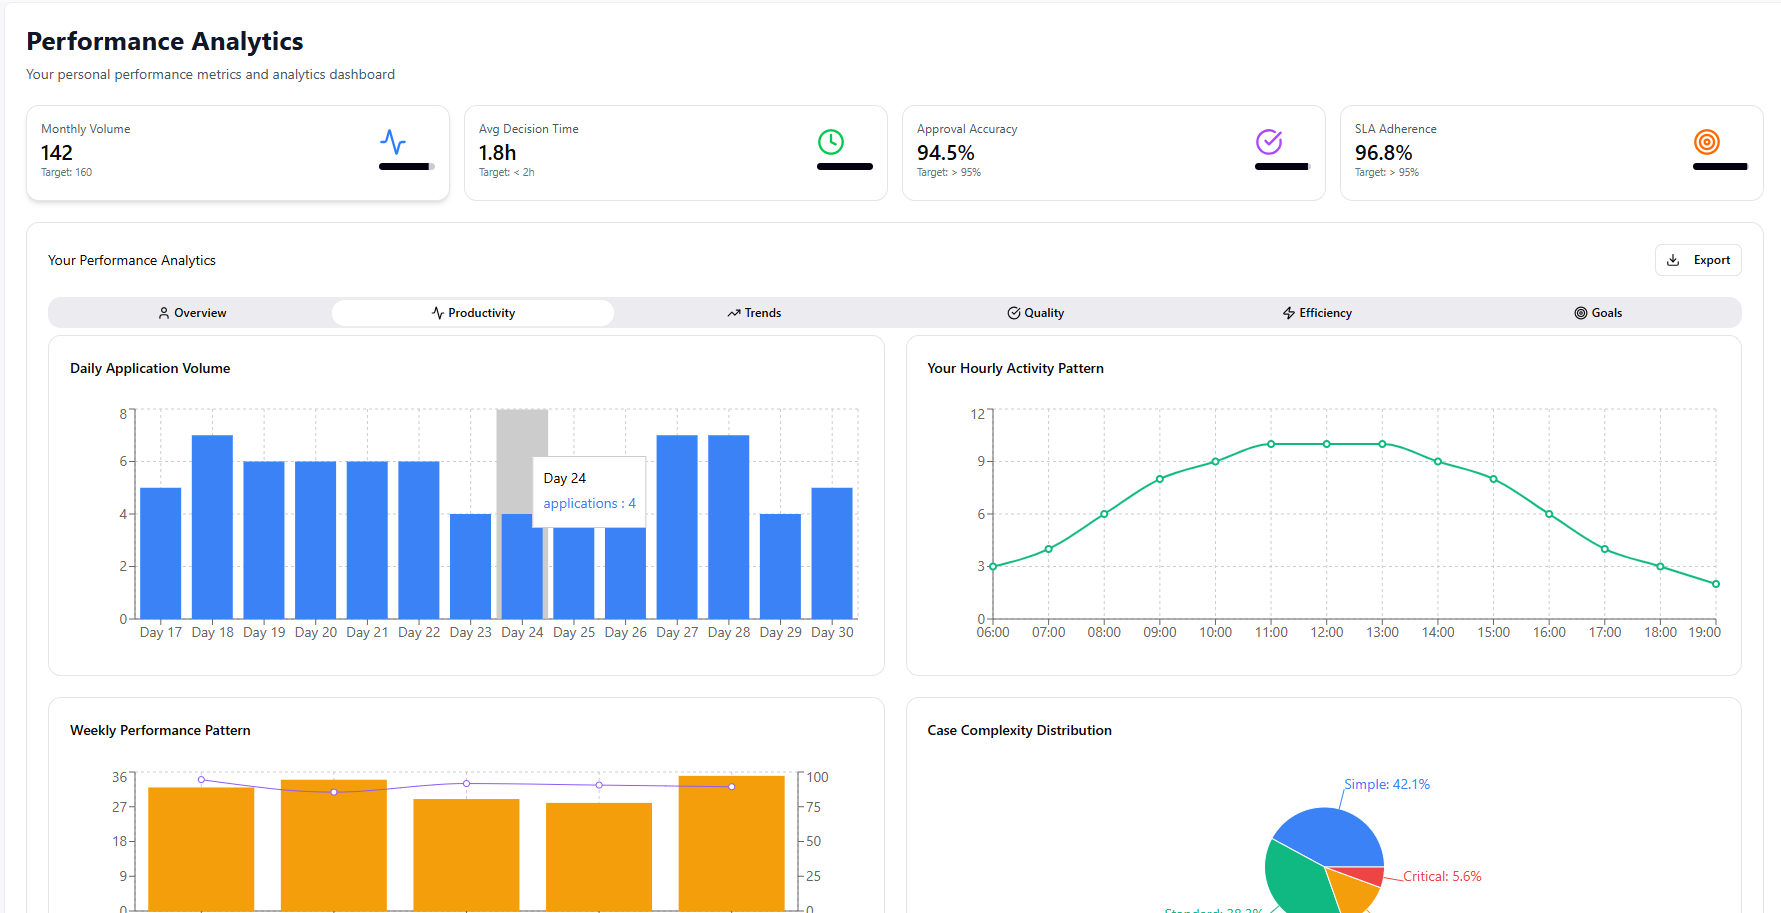
The following visualizations are available:
- Daily Application Volume – Displays the number of applications processed each day.
- Hourly Activity Pattern – Displays application processing activity throughout the working day.
- Weekly Performance Pattern – Displays processing trends across each day of the week.
- Case Complexity Distribution – Displays the percentage distribution of processed applications based on complexity levels, such as Simple, Standard, Complex, and Critical.
Trends
The Trends section provides historical performance analysis to help users monitor changes over time.
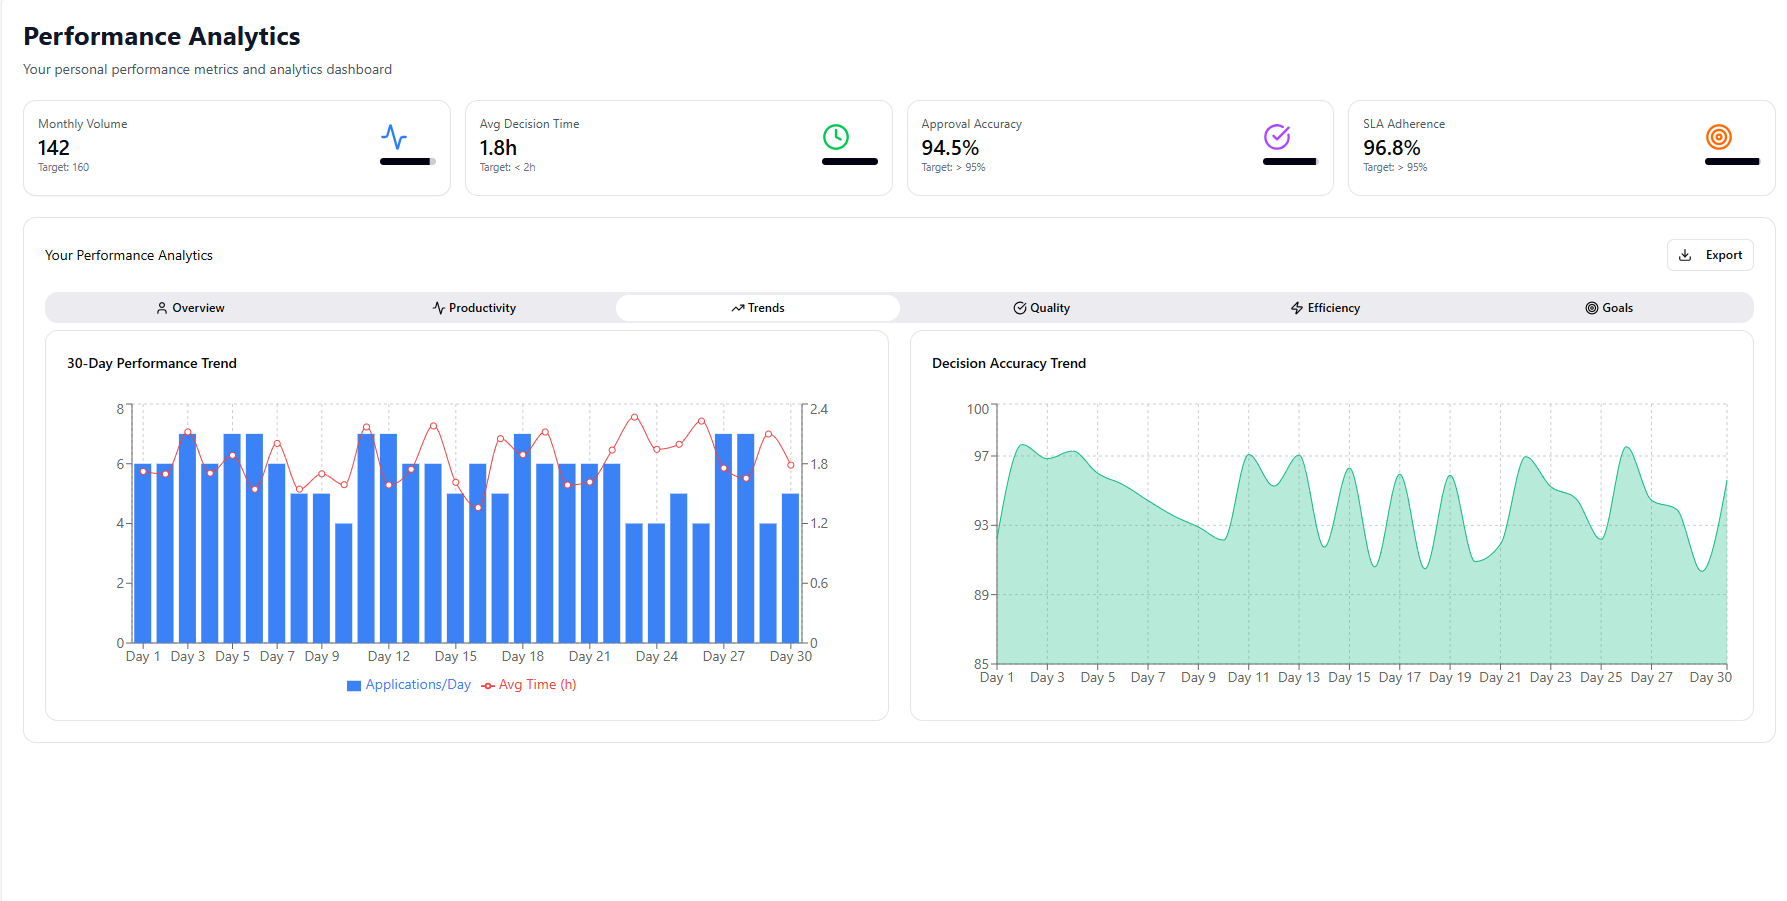
The following charts are available:
- 30-Day Performance Trend – Displays daily application volumes together with average processing time for the selected period.
- Decision Accuracy Trend – Displays changes in decision accuracy over time.
Quality
The Quality section measures the overall quality of credit decisioning activities.
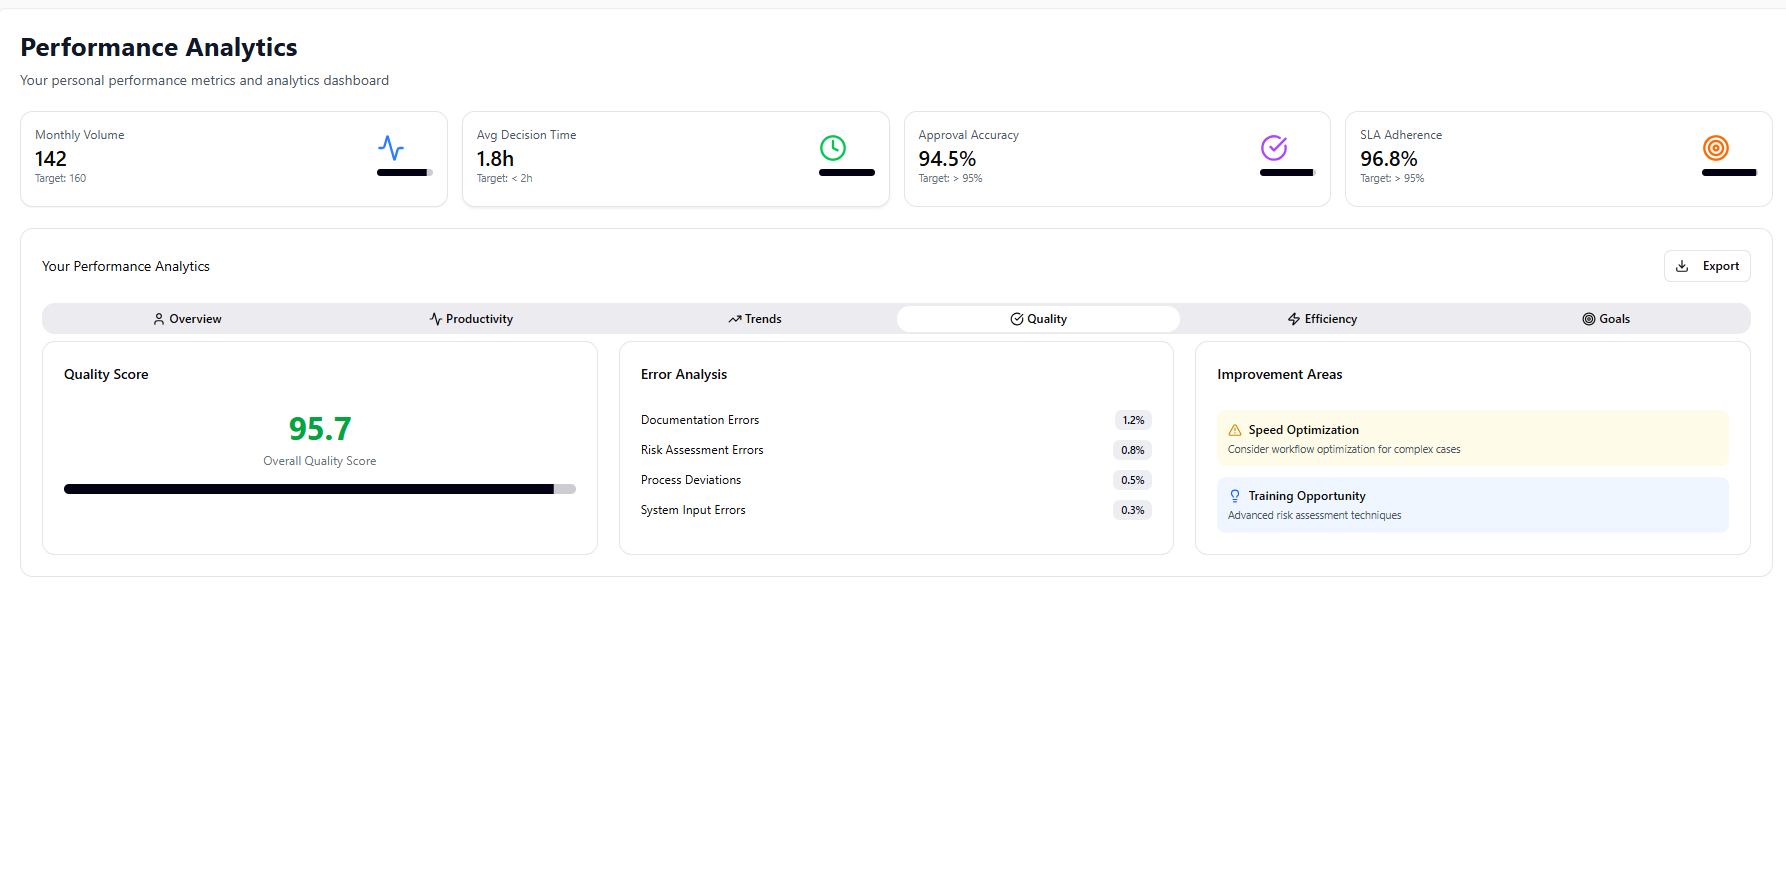
The following information is available:
Quality Score
Displays the analyst’s overall quality score based on completed application reviews.
Error Analysis
Displays the distribution of identified processing errors, including:
- Documentation errors
- Risk assessment errors
- Process deviations
- System input errors
Improvement Areas
Highlights areas where additional improvement or training may be beneficial, including workflow optimization opportunities and recommended skill development.
Efficiency
The Efficiency section measures how effectively applications are processed.
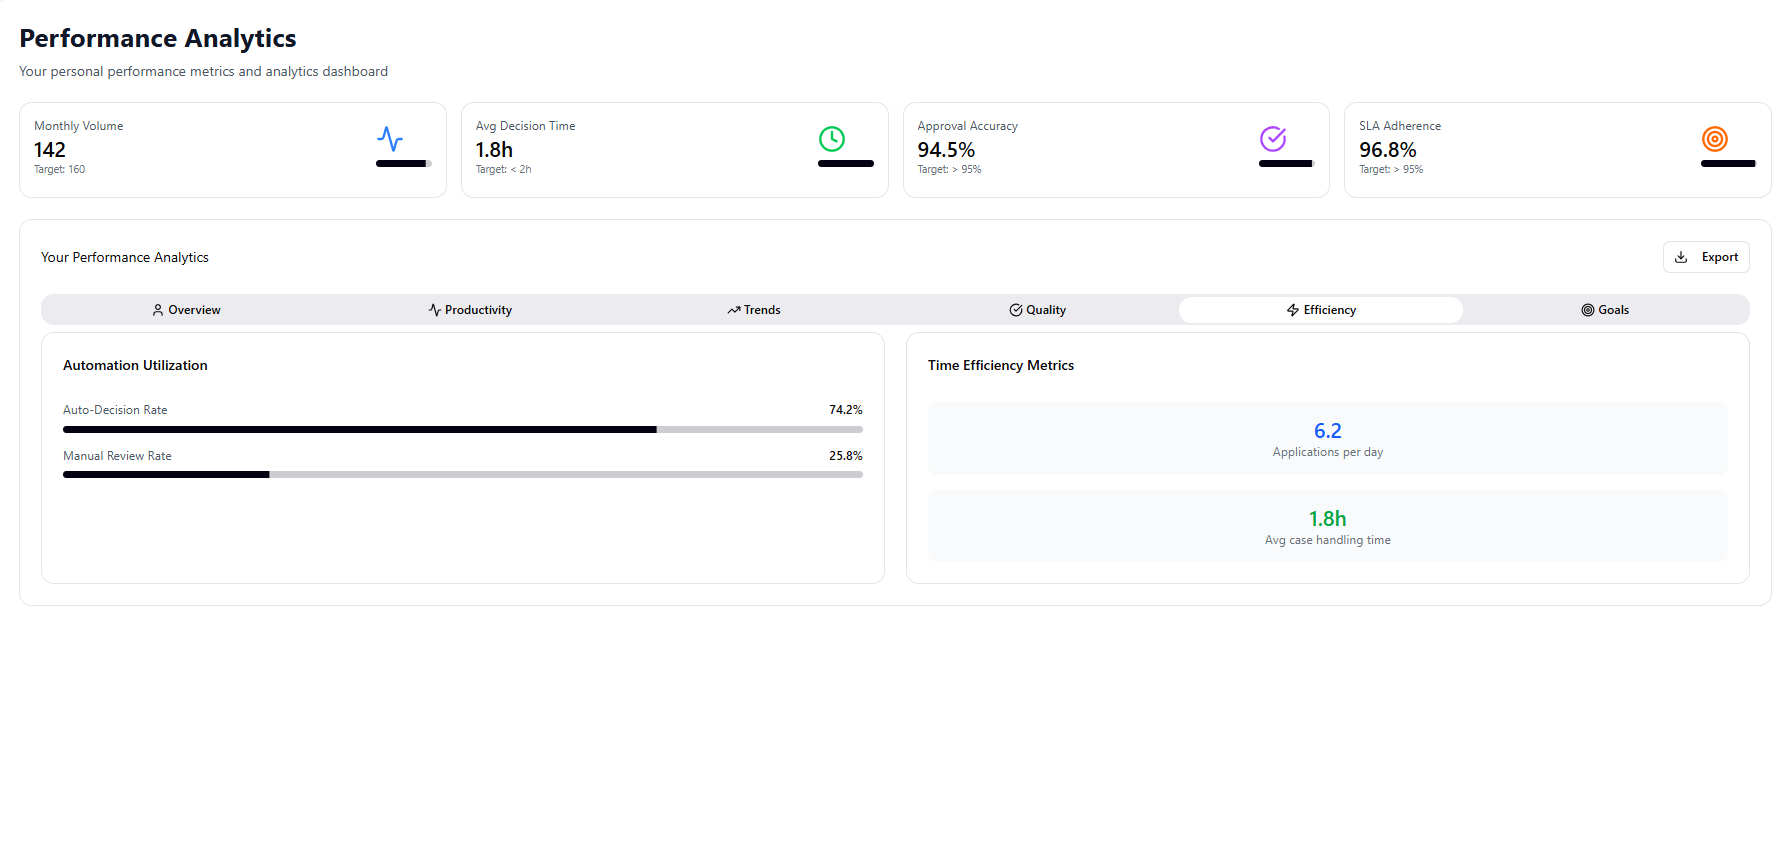
Automation Utilization
Displays:
- Auto-Decision Rate – Percentage of applications processed through automated decisioning.
- Manual Review Rate – Percentage of applications requiring manual review.
Time Efficiency Metrics
Displays key operational efficiency metrics, including:
- Average number of applications processed per day.
- Average case handling time.
Goals
The Goals section compares current performance against defined monthly objectives.
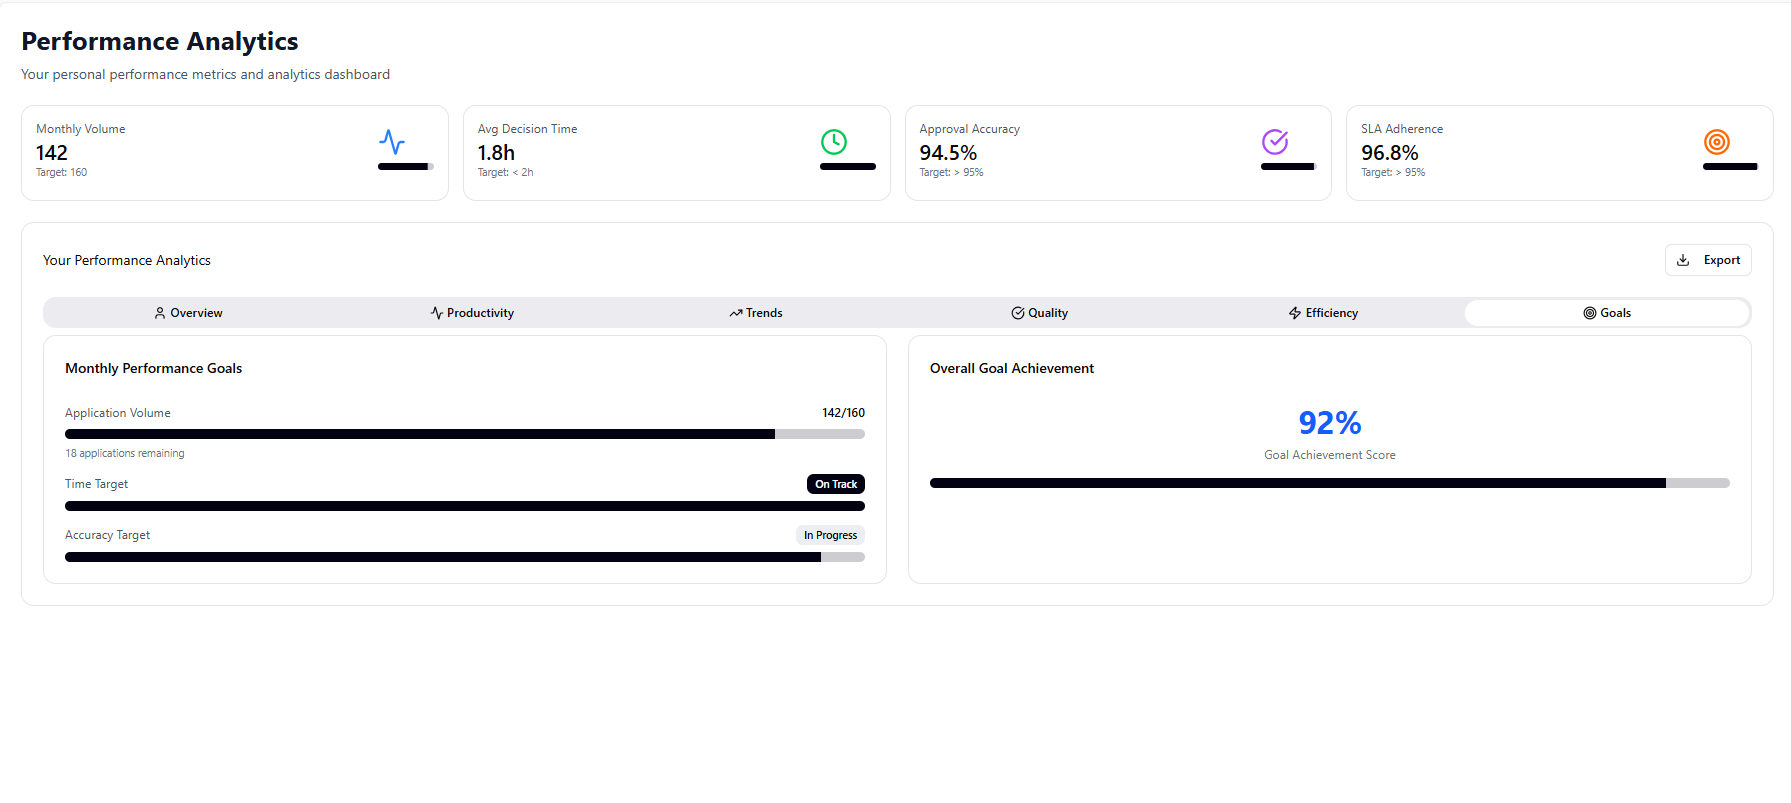
Monthly Performance Goals
Displays progress toward individual performance targets, including:
- Application volume
- Time Target
- Accuracy Target
Overall Goal Achievement
Displays the overall percentage of completed performance goals for the selected reporting period.
Export Analytics
Performance analytics can be exported for reporting and offline analysis.
Supported export formats include:
- CSV
- Microsoft Excel (.xlsx)
Exported reports contain the performance metrics and analytics currently displayed on the screen. Apply any required filters before exporting to generate the desired report.