Team Performance
The Team Performance module in Check provides detailed analytics and insights to evaluate and optimize credit analyst performance. It supports team leads, supervisors, and operations managers in identifying productivity trends, utilization rates, quality scores, automation adoption, and planning needs. Key performance indicators (KPIs) such as Applications per Day, Current Backlog, Average Utilization, SLA Adherence, and Auto-Decision Rate offer a real-time view of team efficiency and individual contributions.
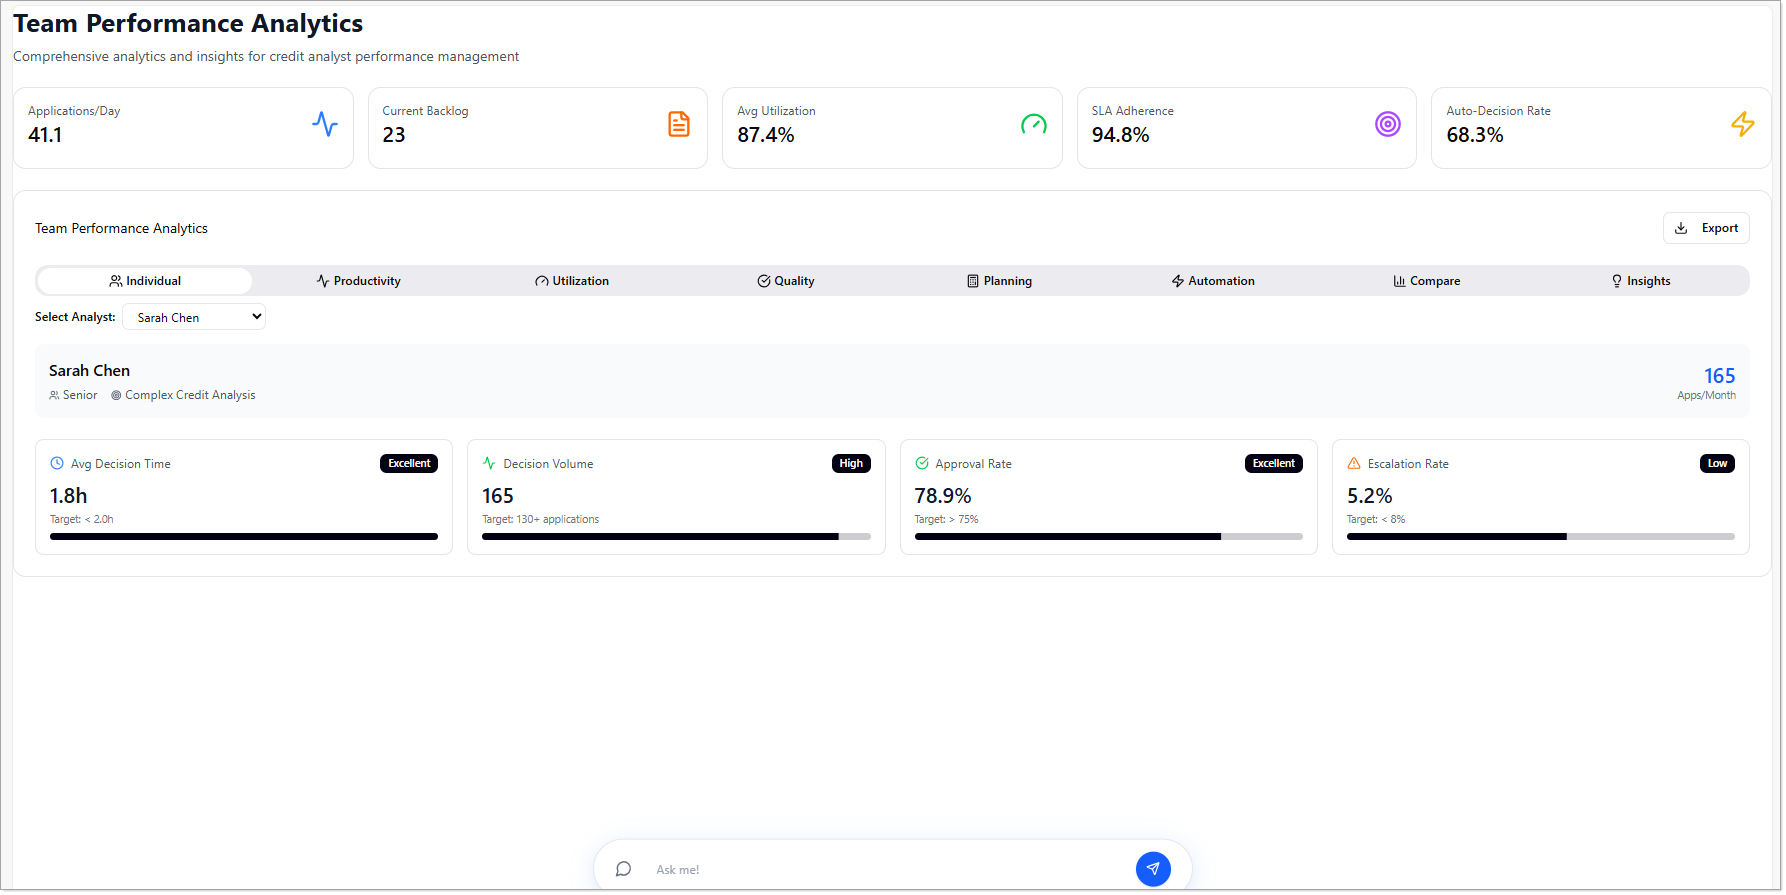
The Team Performance module is intended for supervisors, team leads, and managers to monitor analyst performance, identify operational trends, and support data-driven coaching and resource planning.
Team Performance Analytics
This section includes multiple dashboards organized into thematic categories to help users gain targeted insights.
Individual
Allows users to select a specific analyst to view key individual performance metrics.
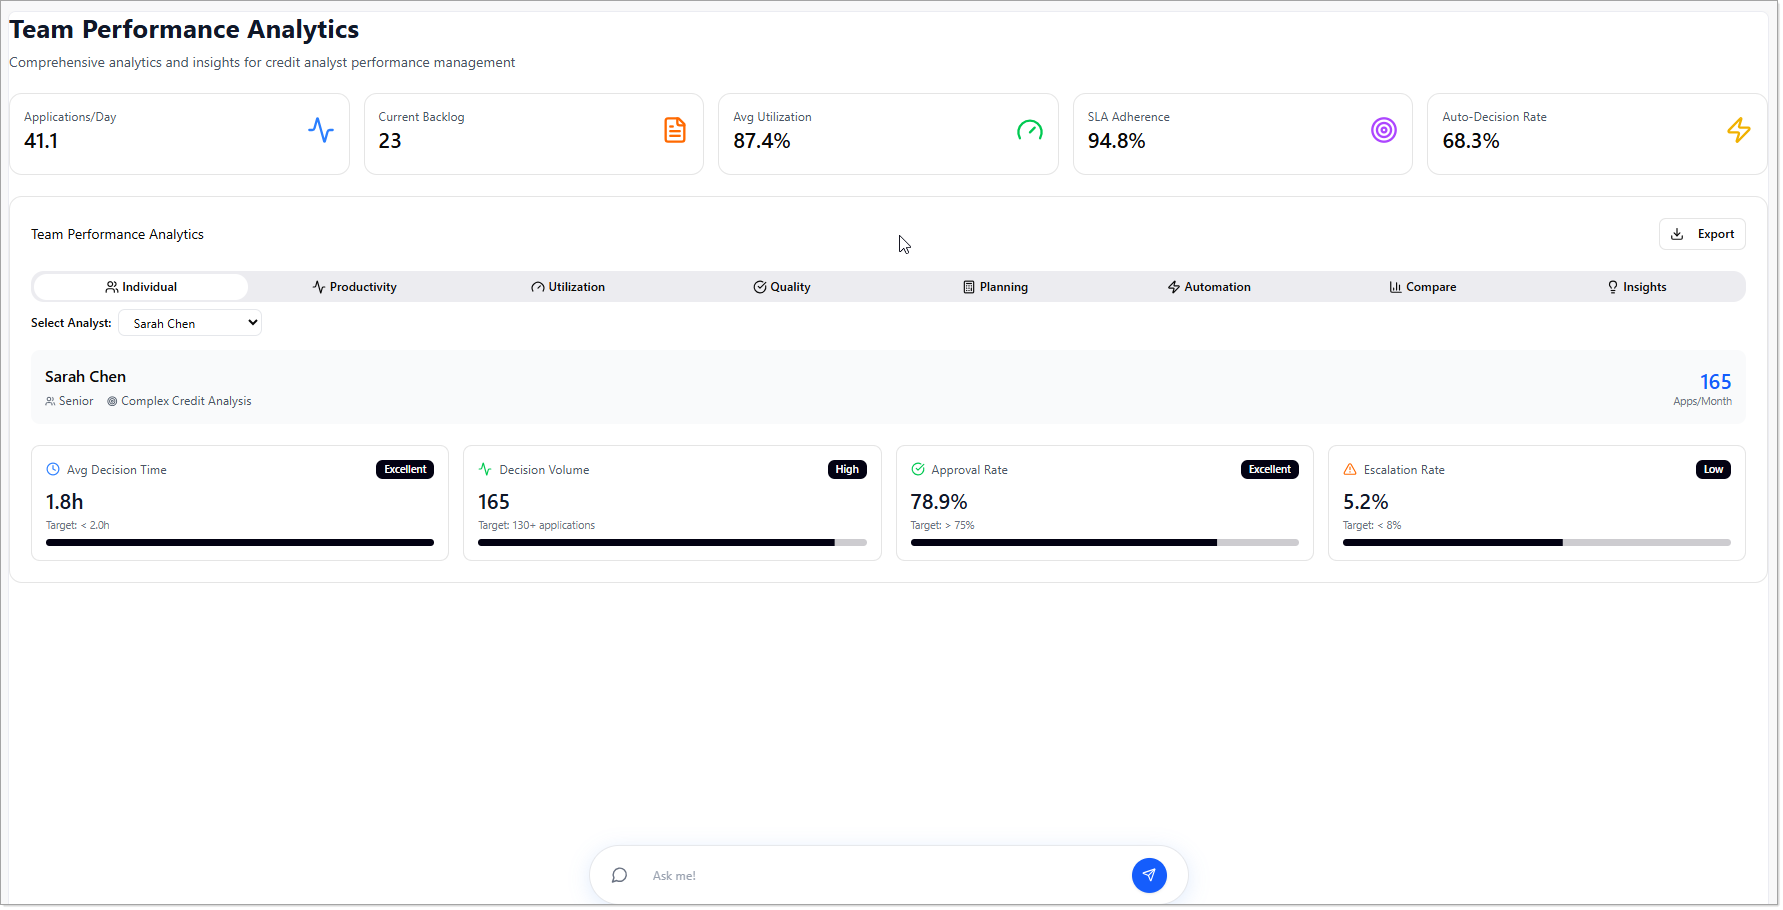
Select an analyst to view individual performance metrics. All charts and statistics are updated based on the selected analyst.
Displayed Metrics:
- Analyst Name – Selected team member under analysis.
- Experience Level – Role level such as Junior, Mid-level, or Senior.
- Analyst Role - Roles such as Mortgage Processing, Complex Credit Analysis, Auto Loans, Commercial Lending, Personal Loans, Risk Assessment and more.
- Average Decision Time – Time taken by the analyst to finalize decisions.
- Decision Volume – Number of applications processed, displayed against target.
- Approval Rate – Percentage of approved applications compared to target.
- Escalation Rate – Rate of escalated cases compared to the acceptable limit.
Productivity
Visualizes trends in analyst output and workload distribution.
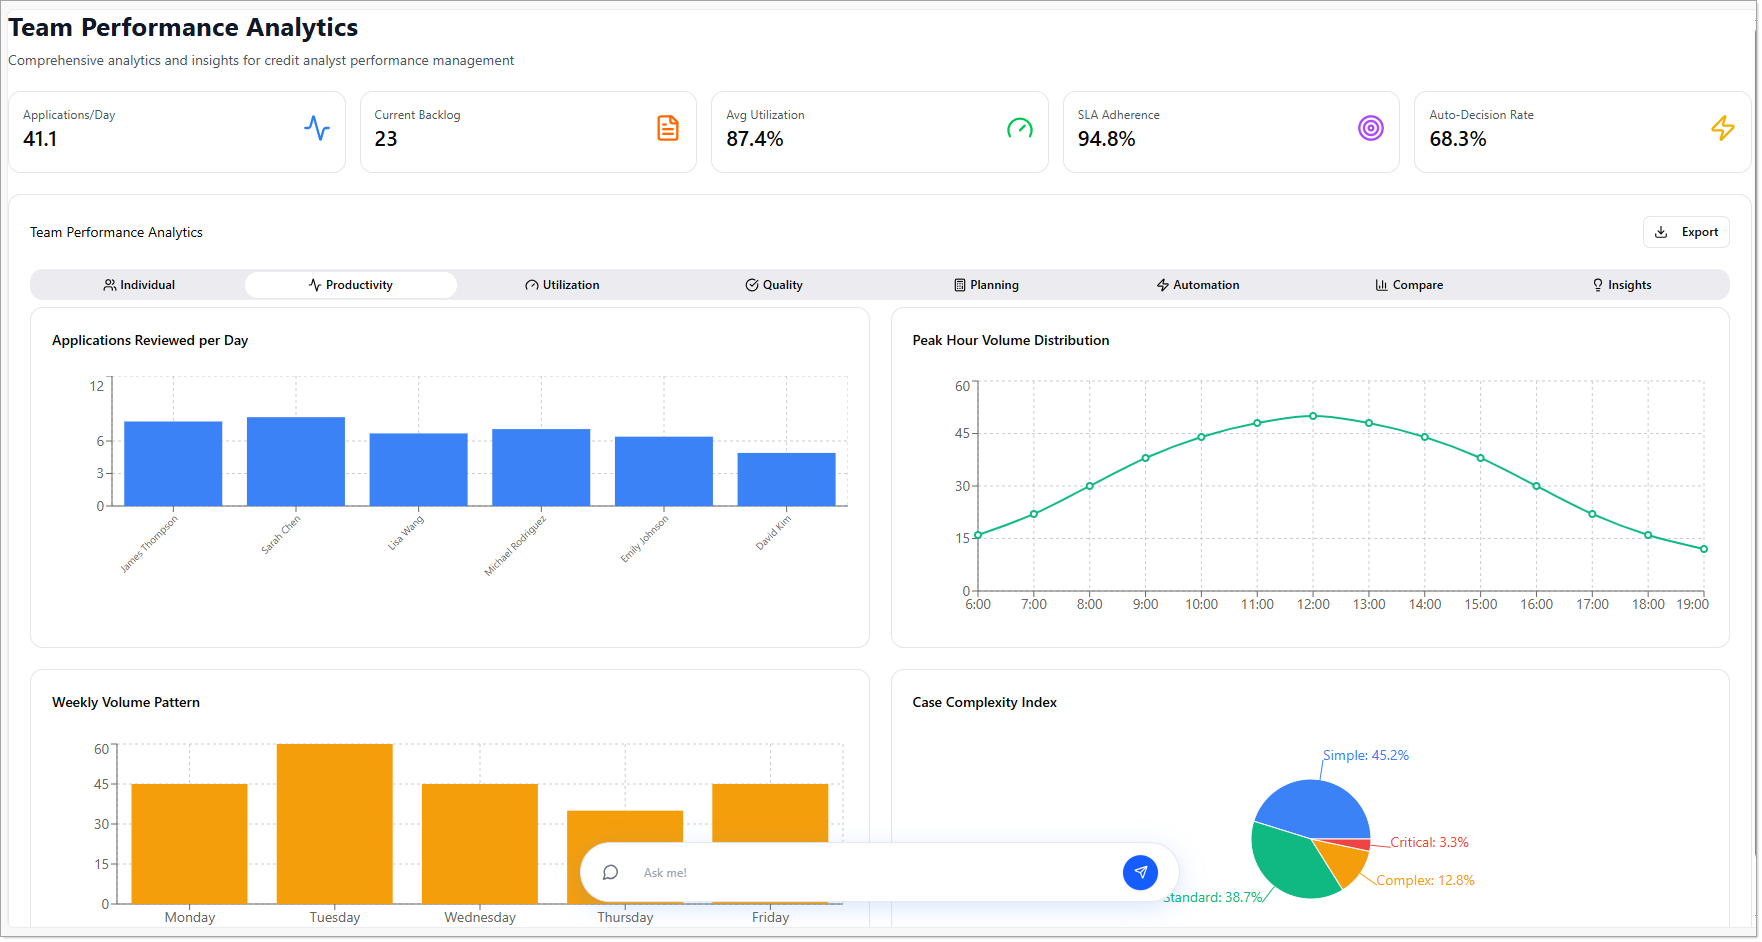
Displays:
- Applications Reviewed per Day – Bar chart showing the number of applications reviewed daily per analyst.
- Peak Hour Volume Distribution – Line/bar chart indicating the busiest hours of the day for each analyst.
- Weekly Volume Pattern – Chart displaying application volume across days of the week (Monday to Sunday).
- Case Complexity Index – Pie chart categorizing processed cases as Simple, Standard, Complex, or Critical.
Utilization
Monitors analyst workload and system usage to identify resource allocation gaps.
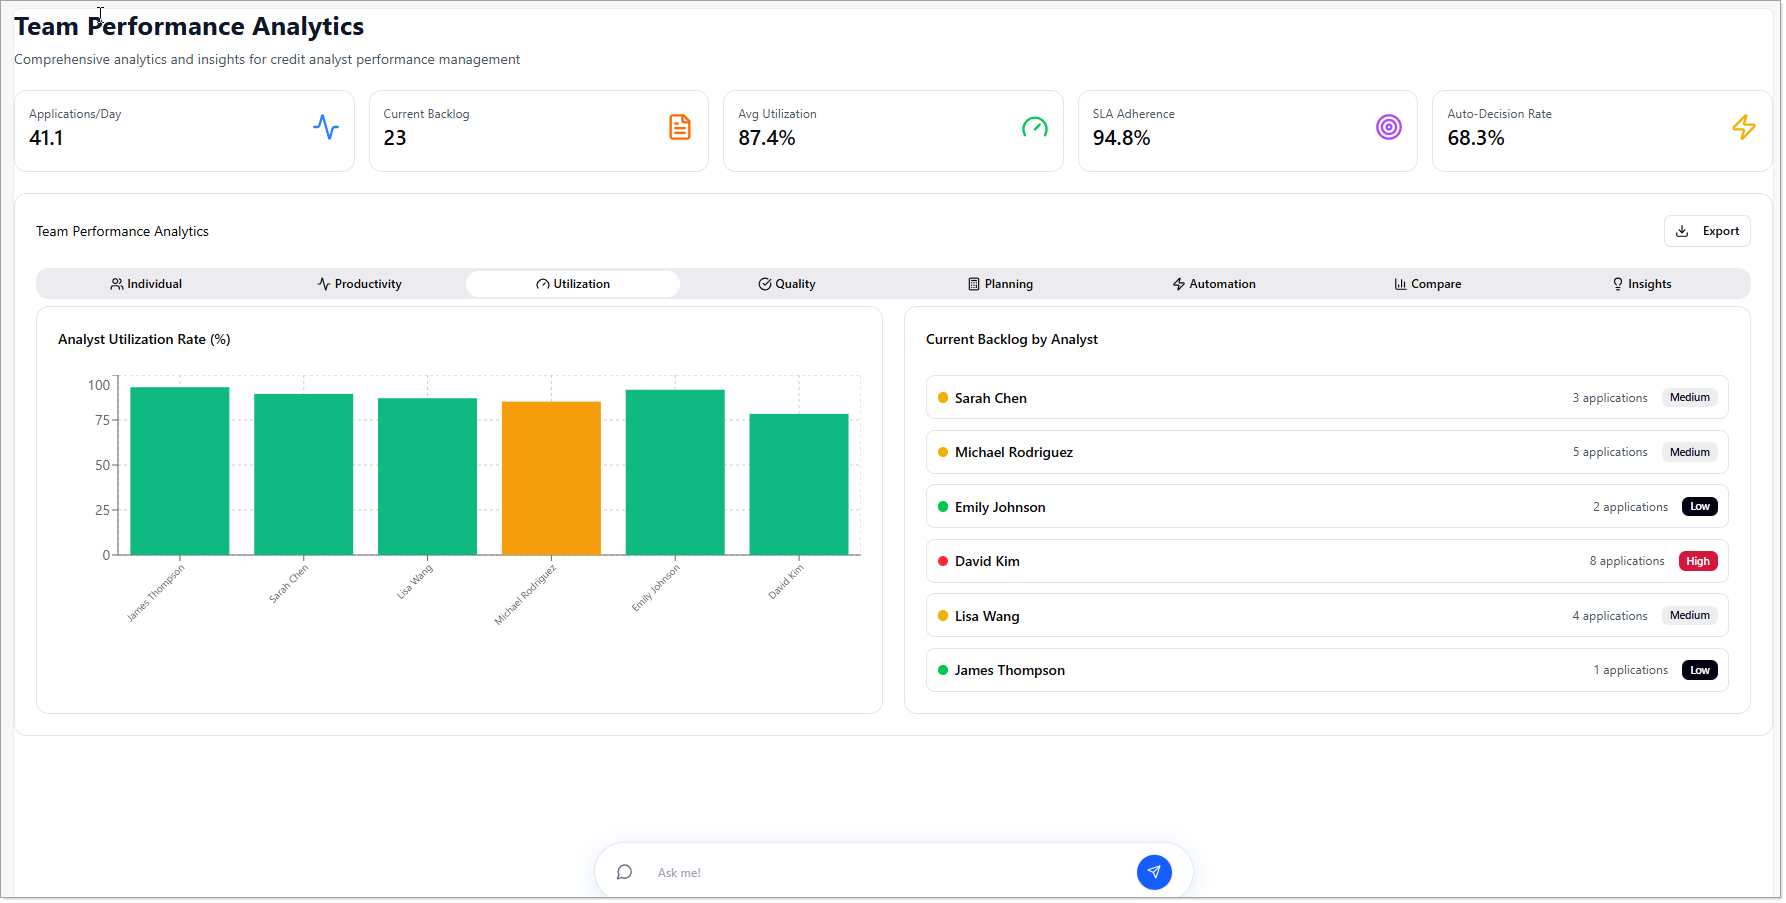
High utilization rates combined with increasing backlogs may indicate resource constraints and can impact application turnaround times.
Displays:
- Analyst Utilization Rate (%) – Bar chart with utilization percentages for each analyst.
- Current Backlog by Analyst – Real-time count of pending applications by analyst.
Quality
Evaluates the accuracy and consistency of analyst decisions.
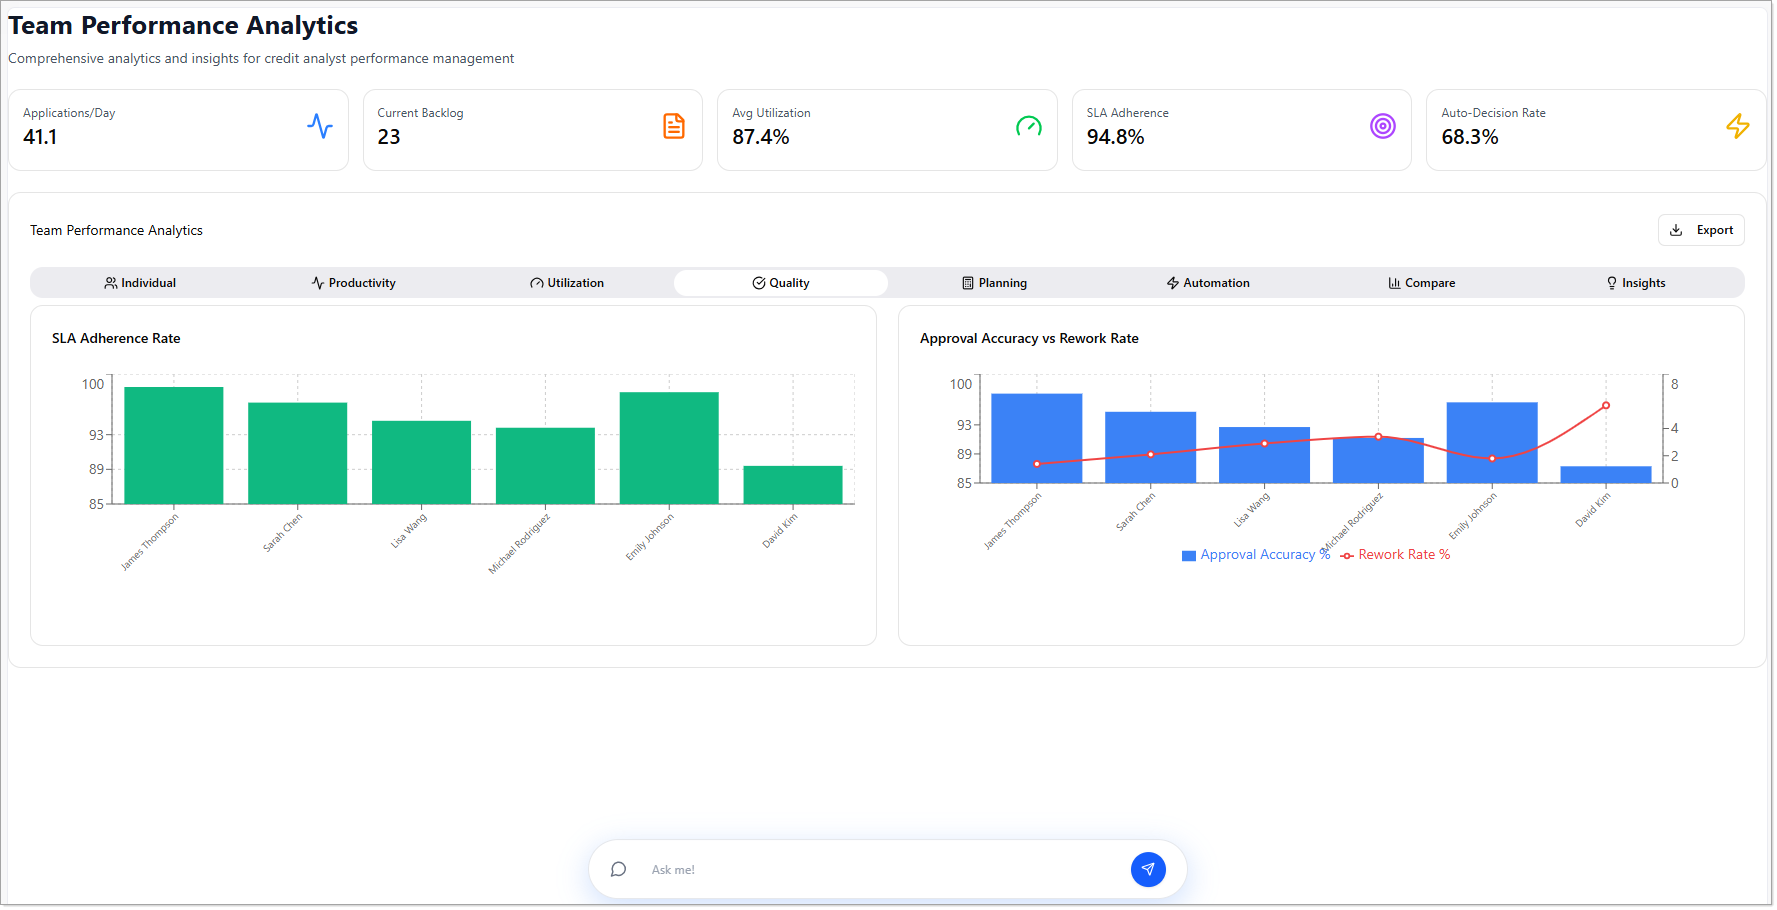
Quality metrics help identify trends in decision accuracy and compliance, enabling timely corrective actions and continuous process improvement.
Displays:
- SLA Adherence Rate – Bar chart showing each analyst’s compliance with defined service-level agreements.
- Approval Accuracy vs Rework Rate – Comparative chart indicating how often decisions are accurate versus how often they require rework.
Planning
Supports workforce and capacity planning through forward-looking metrics.
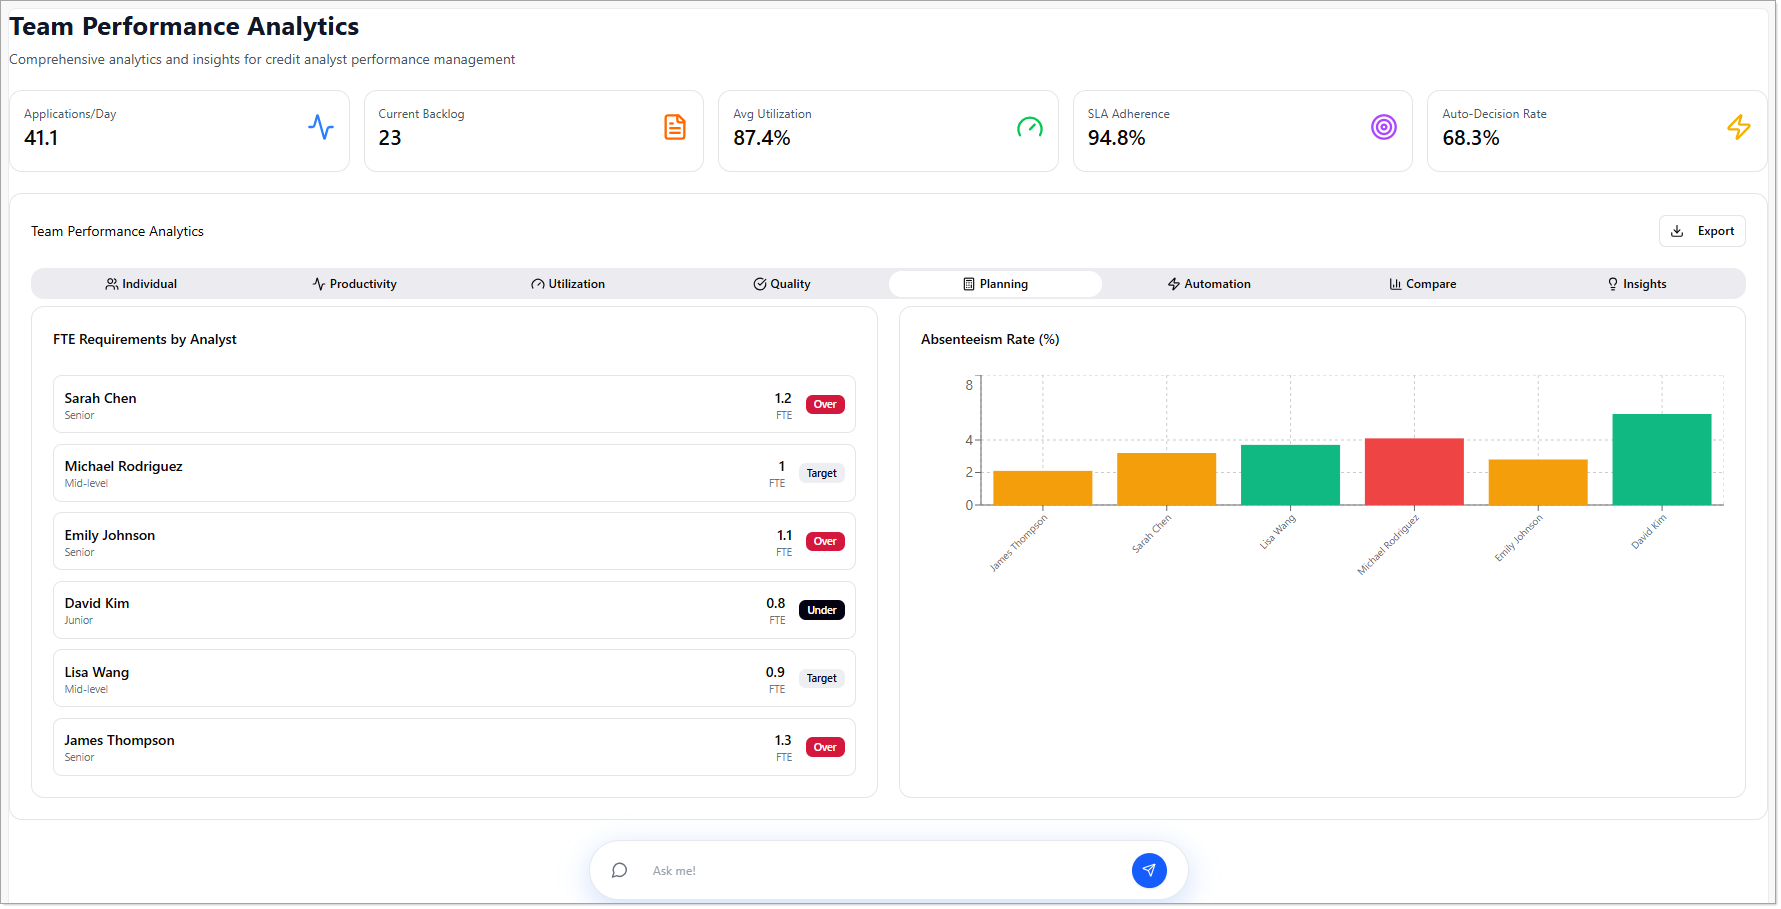
Displays:
- FTE Requirements by Analyst – Assessment of whether staffing levels are over, under, or meeting performance targets.
- Absenteeism Rate (%) – Bar chart showing the rate of absenteeism per analyst.
Automation
Analyzes the use of automation tools and AI support in credit decisioning.
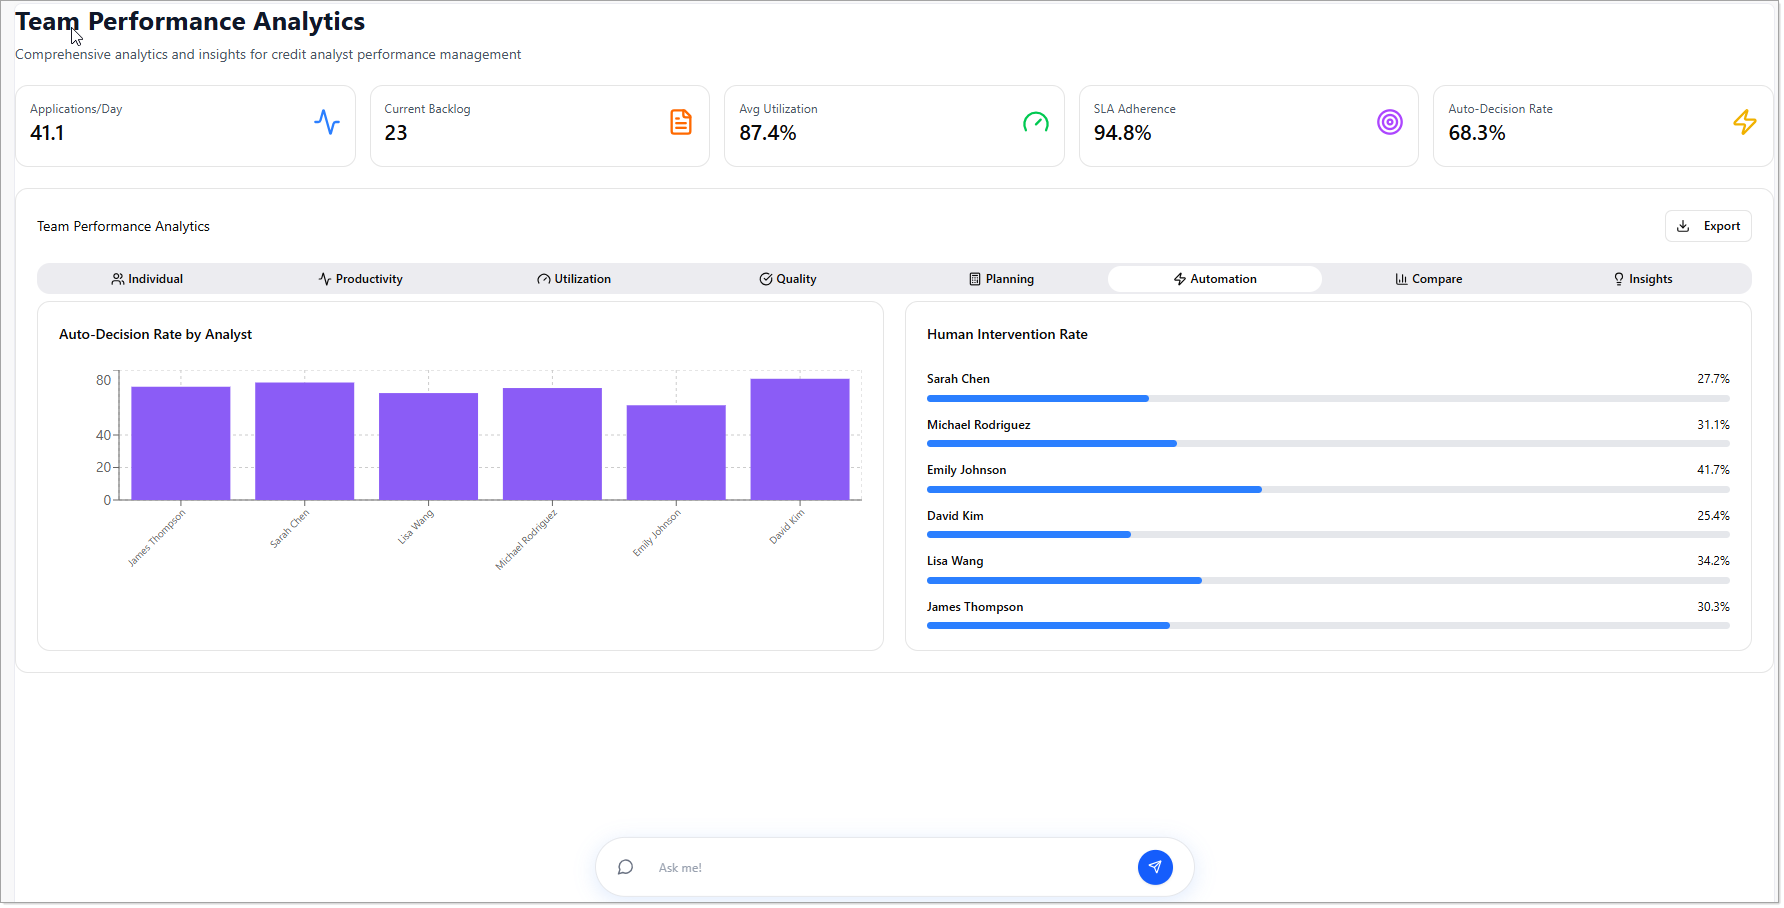
A higher Auto-Decision Rate indicates greater utilization of automated decisioning capabilities, while the Human Intervention Rate highlights applications requiring manual review.
Displays:
- Auto-Decision Rate by Analyst – Bar chart representing the number of auto-decisions made per analyst.
- Human Intervention Rate – Percentage of applications requiring manual review or intervention.
Compare
Enables performance benchmarking within the team.
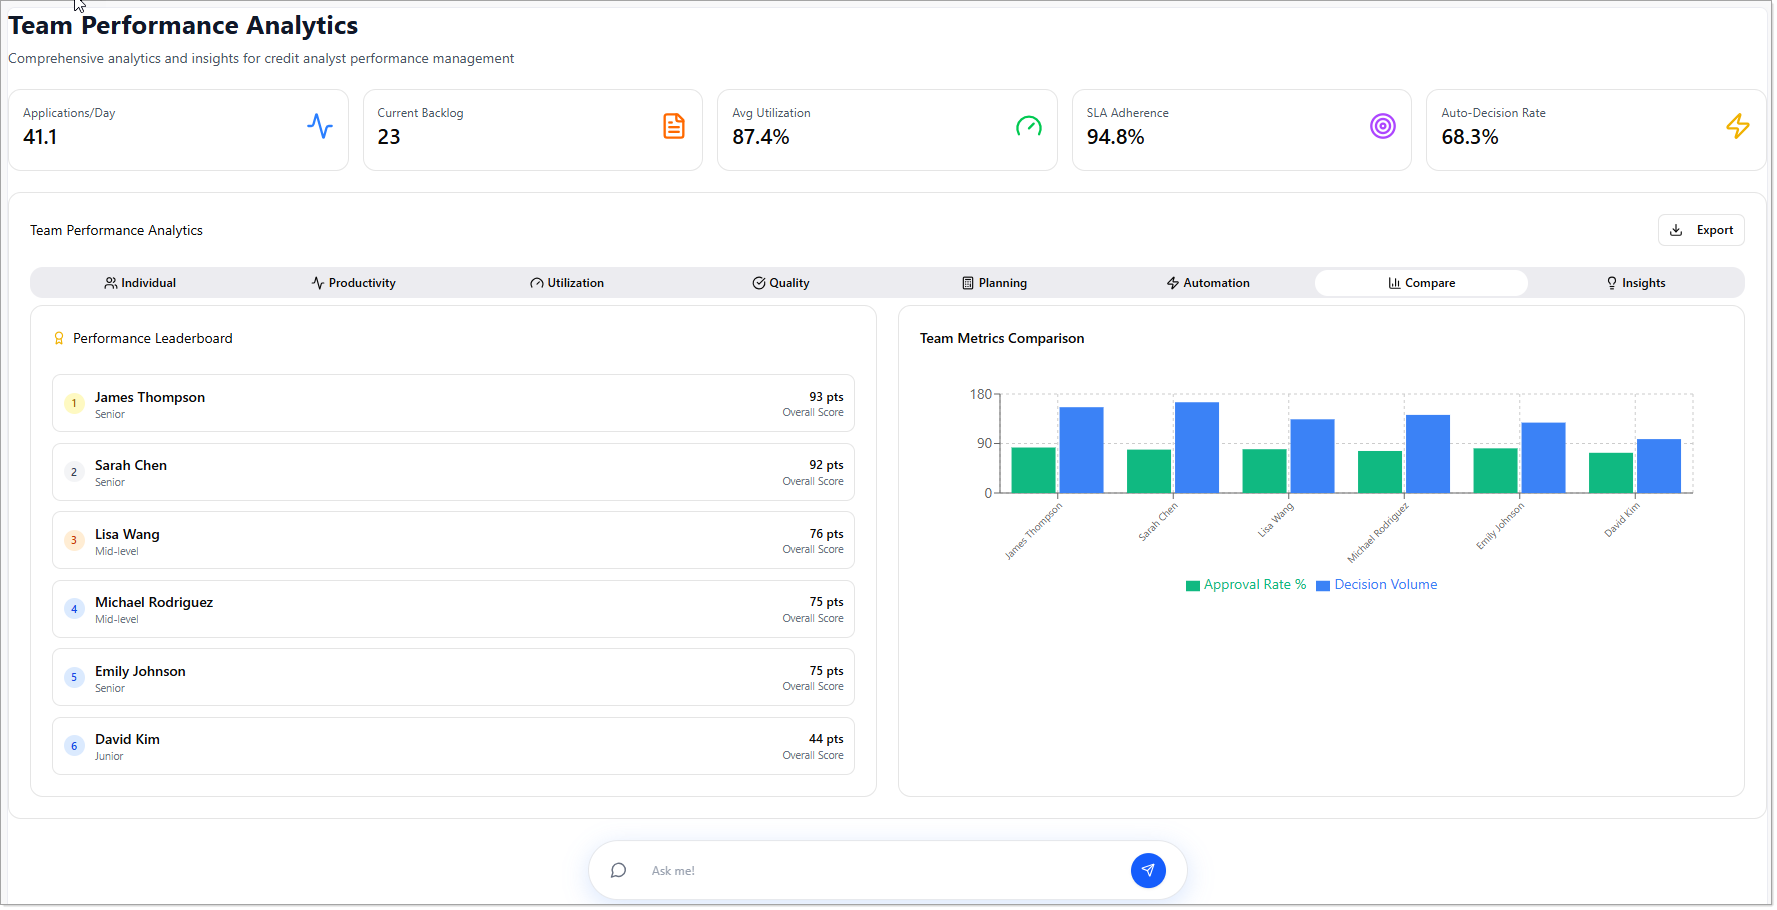
Use comparison metrics to benchmark analyst performance, identify high-performing team members, and recognize opportunities for coaching and workload balancing.
Displays:
- Performance Leaderboard – Ranked view of all analysts based on composite performance metrics.
- Team Metrics Comparison – Comparative chart showing Decision Volume and Approval Rates per analyst.
Insights
Provides actionable recommendations based on analytics data to improve team performance.
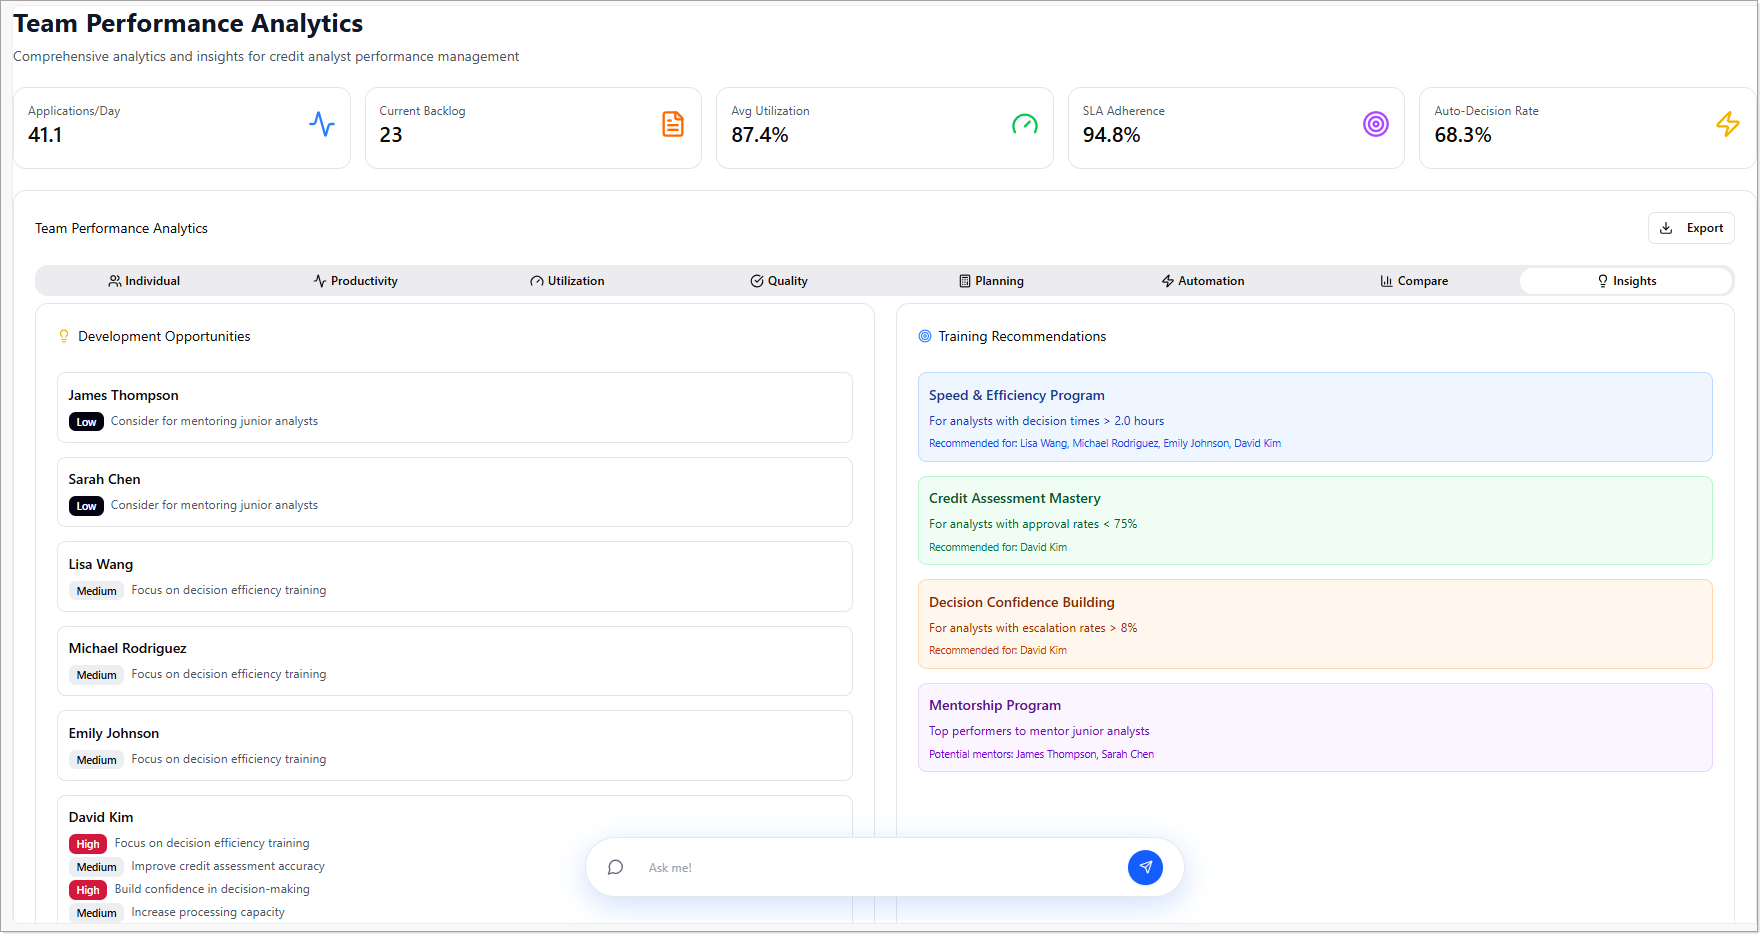
Performance insights are generated using current operational data and are intended to support performance monitoring, coaching, and workforce planning. Recommendations should be considered alongside organizational policies and business objectives.
Displays:
- Development Opportunities – Tailored suggestions for individual analyst development.
- Training Recommendations – Suggested training programs for the team based on performance trends.
- 30-Day Action Plan – Short-term improvement plan aligned with identified gaps and goals.